6. Applying Anomaly Detection Workflow to Multiple Grid Data Points
To apply the entire workflow, including computing the climatology and detecting anomalies, on multiple grid data points (country-level analysis or bounding box), you can execute the run command via the command line and pass the required positional and optional arguments. This workflow provides implementations for multiple detection methods on multiple dates simultaneously.
6.1 Positional Arguments
data_path: Path to the ASCAT data.
aoi: Country name or bounding box coordinates in the tuple 'lon_min, lon_max , lat_min, lat_max'.
time_step: The time step for the climatology calculation. Supported values: month, dekad, week, bimonth, day.
6.2 Optional Arguments
-h, --help: Show the help message and exit.
--data_read_bulk : Read data in bulk mode. If set to 'True', all data will be read into memory.
--variable : The variable to be used for anomaly detection.
--year : The year(s) for the date parameters.
--month : The month(s) for the date parameters.
--dekad : The dekad(s) for the date parameters.
--week : The week(s) for the date parameters.
--bimonth : The bimonth(s) for the date parameters.
--day : The day(s) for the date parameters.
--methods : Anomaly detection methods. Supported methods: zscore, smapi-mean,
                         smapi-median, smdi, smca-mean, smca-median, smad, smci, smds, essmi, beta, gamma, abs-mean, abs-median.
--timespan : To work on a subset of the data. Example: ['2012-01-01', '2012-12-31'].
--fillna : Fill missing values.
--fillna_size : Fillna window size.
--smoothing : Apply smoothing.
--smooth_size : Smoothing window size.
--workers : The number of workers to use for multiprocessing.
--addi_retrive : Retrieve observations and climatology values
--save_to : Save the output to a file at the specified path.
6.3 Workflow Syntax
! smadi_run <data_directory> <country name or bbox> <time_step for climatology> [Options]
Note for the optional parameters
Multiple Methods: To implement multiple methods, use the optional argument
--methodsfollowed by the desired methods.For example, to implement ZScore, SMAD, and Beta:
bash --methods 'zscore' 'smad' 'beta'Multiple Dates: To implement computations for multiple dates, provide the date components to the date parameters such as year, month, week, etc. , respectively
For example, to implement computations for January, February 2022, and July 2021:
--year 2022 2022 2021 --month 1 2 7
Workflow Usage Example (Spain June, July 2021 using monthly Zscore and SMAD)
[1]:
# Compute four anomaly maps for Spain using the ZScore and SMAD methods for June and July 2021
! run_smadi     "/home/m294/ascat_dataset"        \
                "spain"                           \
                'month'                           \
                --variable "sm"                   \
                --year 2021 2021                  \
                --month 6 7                       \
                --methods 'zscore' 'smad'         \
                --fillna True                     \
                --fillna_size 3                   \
                --smoothing True                  \
                --smooth_size 31                  \
                --addi_retrive "var" "norm" "abs" \
                --save_to "output_df.csv"
[2]:
import pandas as pd

workflow_df = pd.read_csv("output_df.csv")
workflow_df.dropna(inplace=True)
workflow_df.head()
[2]:
| Unnamed: 0 | point | cell | grid | lat | lon | zscore(2021-6) | sm-mean(2021-6) | norm-mean(2021-6) | abs-mean(2021-6) | zscore(2021-7) | sm-mean(2021-7) | norm-mean(2021-7) | abs-mean(2021-7) | smad(2021-6) | norm-median(2021-6) | abs-median(2021-6) | smad(2021-7) | norm-median(2021-7) | abs-median(2021-7) | |
|---|---|---|---|---|---|---|---|---|---|---|---|---|---|---|---|---|---|---|---|---|
| 5 | 5 | 3865001 | 1249 | Fibonacci (6.25 km) | 36.028694 | -5.561161 | 0.013453 | 31.547784 | 31.493567 | 0.054216 | 0.284715 | 27.154701 | 26.068401 | 1.086300 | 0.150779 | 30.674441 | 0.873343 | 0.316017 | 25.006983 | 2.147718 |
| 10 | 10 | 3867585 | 1249 | Fibonacci (6.25 km) | 36.056431 | -5.623466 | 0.009931 | 17.819483 | 17.785313 | 0.034170 | 0.106970 | 20.508821 | 20.136111 | 0.372710 | 0.064738 | 17.493552 | 0.325931 | 0.083739 | 20.055218 | 0.453603 |
| 13 | 13 | 3869182 | 1249 | Fibonacci (6.25 km) | 36.073578 | -5.522654 | 0.175946 | 36.727798 | 36.036751 | 0.691046 | 0.440747 | 29.178583 | 27.606710 | 1.571874 | 0.233799 | 35.258501 | 1.469297 | 0.378327 | 26.981760 | 2.196823 |
| 15 | 15 | 3870169 | 1249 | Fibonacci (6.25 km) | 36.084175 | -5.685771 | -0.099112 | 17.047304 | 17.410369 | -0.363065 | -0.062329 | 20.650748 | 20.890512 | -0.239765 | -0.038218 | 17.229306 | -0.182002 | -0.027507 | 20.797736 | -0.146989 |
| 18 | 18 | 3871766 | 1249 | Fibonacci (6.25 km) | 36.101330 | -5.584959 | -0.301901 | 16.005311 | 16.864132 | -0.858821 | -0.174176 | 16.600788 | 17.065579 | -0.464790 | -0.091814 | 16.365981 | -0.360670 | 0.005729 | 16.577429 | 0.023359 |
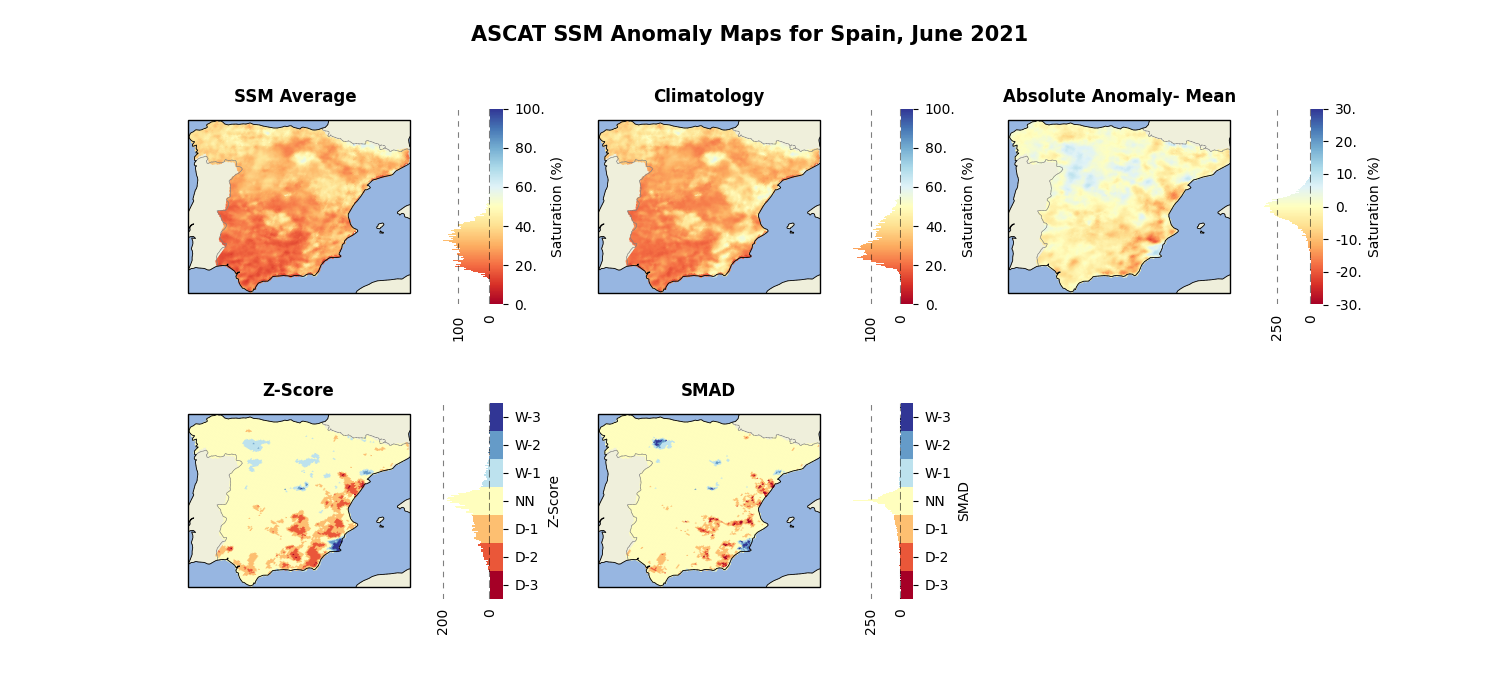
Plot the anomaly maps
[3]:
from smadi.map import plot_anomaly_maps

# Select the data columns to map
colms = [
    "sm-mean(2021-6)",
    "norm-mean(2021-6)",
    "abs-mean(2021-6)",
    "zscore(2021-6)",
    "smad(2021-6)",
]

# Set the title for each map
titles = ["SSM Average ", "Climatology", "Absolute Anomaly- Mean", "Z-Score", "SMAD"]

plot_anomaly_maps(
    figsize=(15, 7),
    ax_cols=3,
    ax_rows=2,
    df=workflow_df,
    df_colms=colms,
    figure_title="ASCAT SSM Anomaly Maps for Spain, June 2021",
    maps_titles=titles,
    add_gridlines=False,
    add_features=True,
    cb_min_max=[
        "sm_clim",
        "sm_clim",
        "abs",
        "anomaly",
        "anomaly",
    ],  # This param for compute min and max values for colorbar of each map according its values
    # "anomaly" for  anomaly maps and "sm_clim" for average/ climatology maps
    # "abs" for absolute anomaly maps. or set vmin and vmax manually
    # It should has the same length as df_colms and maps_titles
    cb_label=[
        "Saturation (%)",
        "Saturation (%)",
        "Saturation (%)",
        "Z-Score",
        "SMAD",
    ],  # This param for set the colorbar label for each map
)
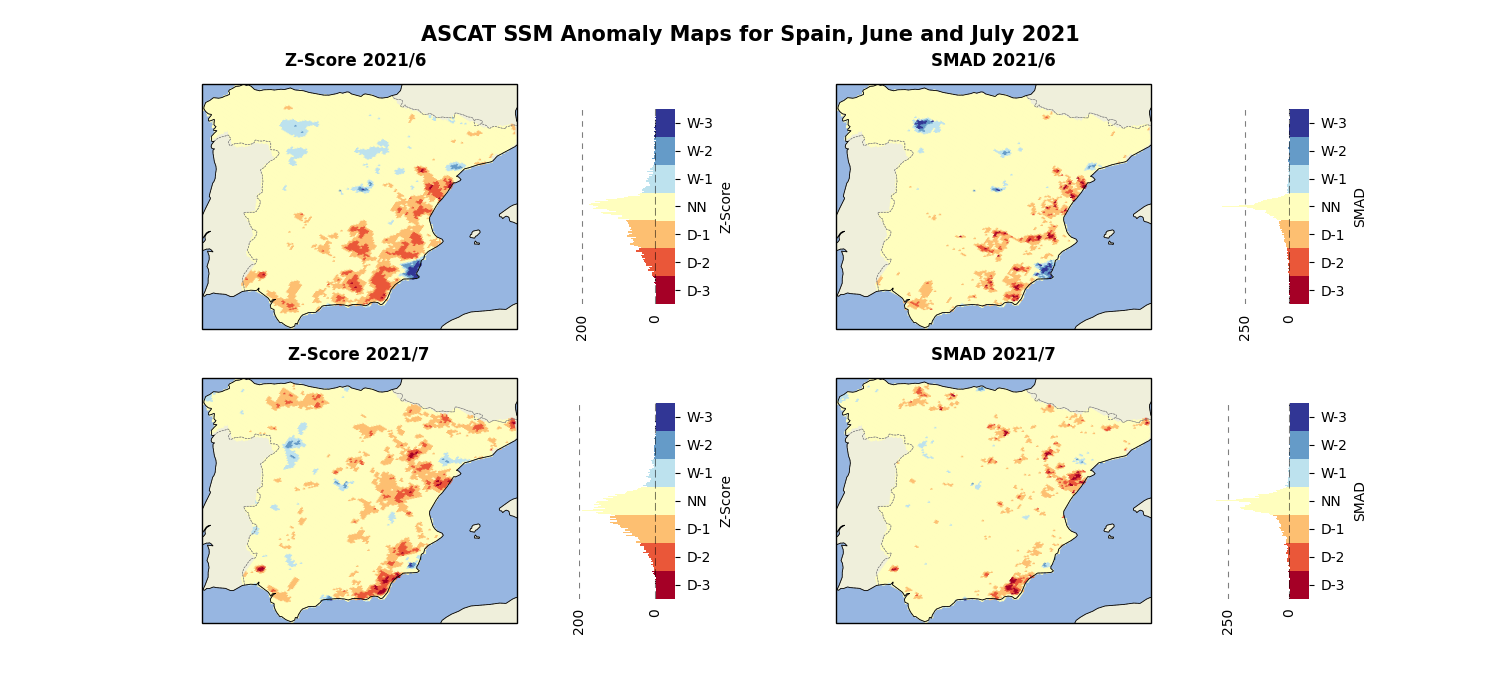
[7]:
colms = [
    "zscore(2021-6)",
    "smad(2021-6)",
    "zscore(2021-7)",
    "smad(2021-7)",
]

# Set the title for each map
titles = ["Z-Score 2021/6 ", "SMAD 2021/6", "Z-Score 2021/7", "SMAD 2021/7"]

plot_anomaly_maps(
    figsize=(15, 7),
    ax_cols=2,
    ax_rows=2,
    df=workflow_df,
    df_colms=colms,
    figure_title="ASCAT SSM Anomaly Maps for Spain, June and July 2021",
    maps_titles=titles,
    add_gridlines=False,
    add_features=True,
    cb_min_max=["anomaly", "anomaly", "anomaly", "anomaly"],
    cb_label=["Z-Score", "SMAD", "Z-Score", "SMAD"],
)